> WORK ARCHIVE LOADED
Operational Systems I Built
Data platforms, dashboards, automation tools, and reporting systems built to reduce manual work,
improve accuracy, and turn messy operational data into usable systems.
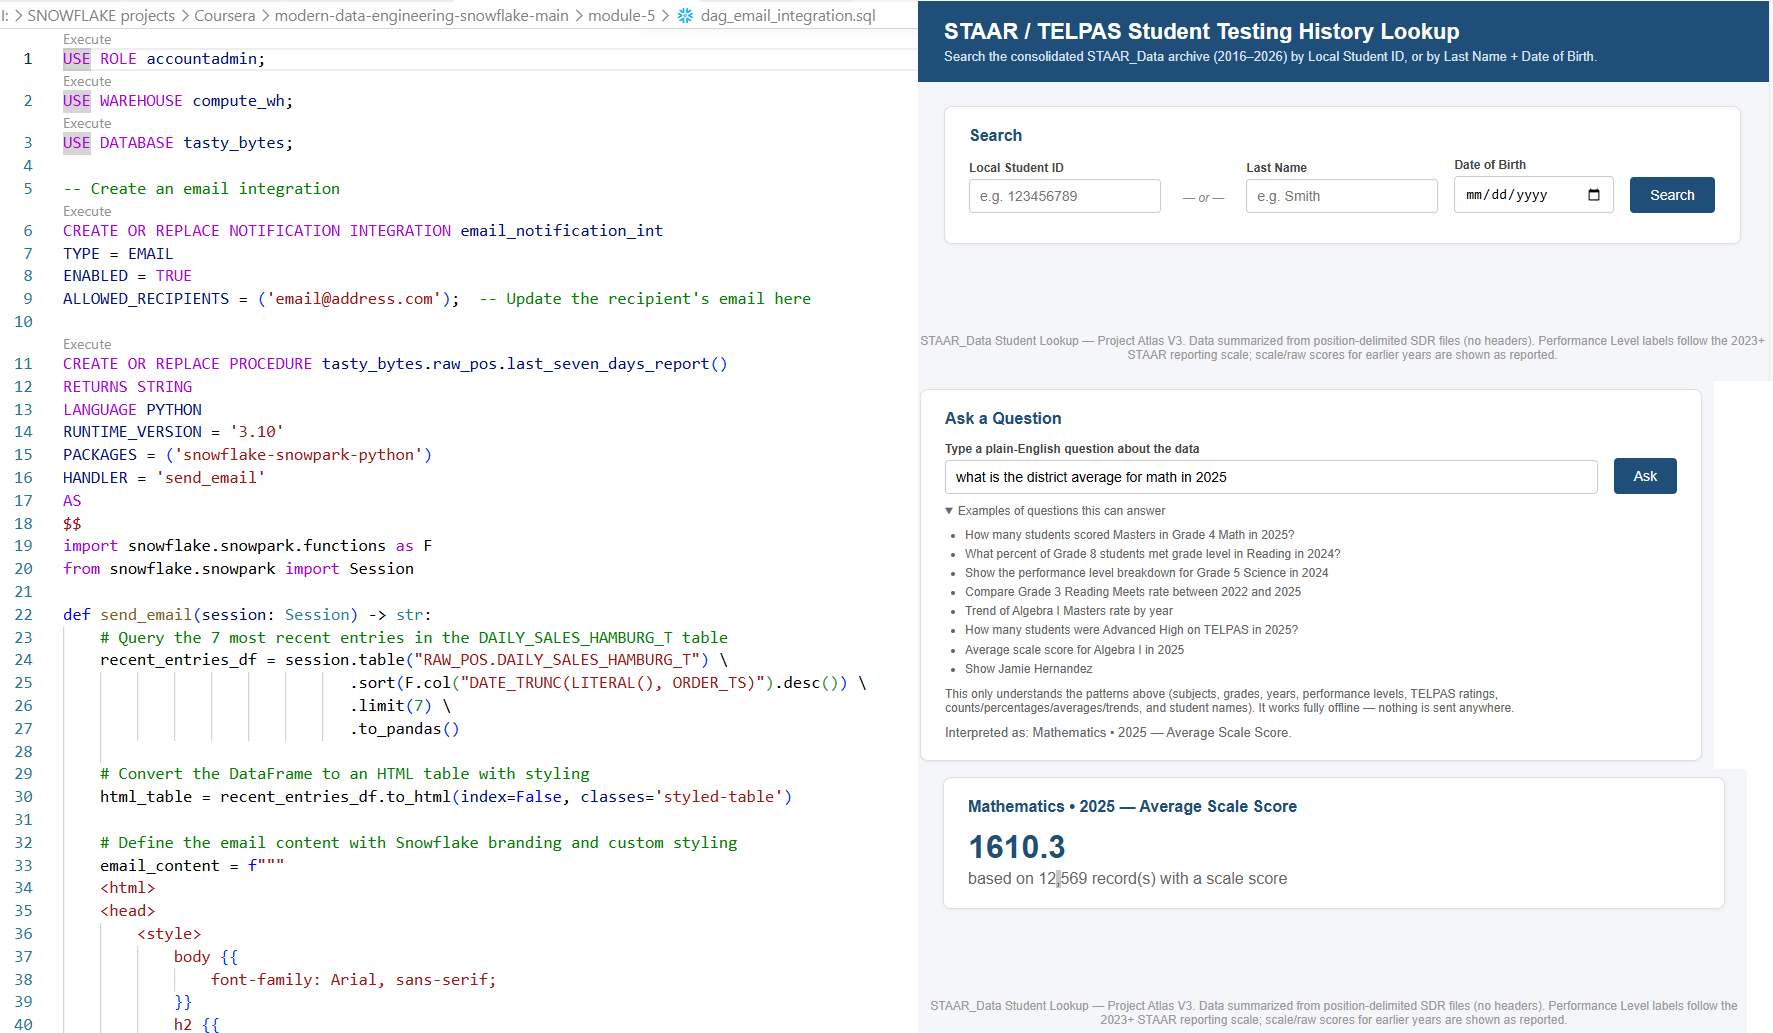
District Data Platform
Layered data warehouse using raw, staging, and analytics schemas.
> Problem
District data existed across multiple vendor systems
with no centralized reporting platform.
> Solution
Designed and implemented a district-wide data platform
integrating Focus SIS, OnDataSuite, Eduphoria,
assessment vendors, and TEA data into centralized
reporting models and analytics workflows.
Snowflake
SQL
Power BI
Python
ETL
Data Modeling
> Impact
- 30,000 Students
- 49 Campuses
- 10+ Power BI Models
- Executive Reporting
- Accountability Reporting
VIEW GITHUB
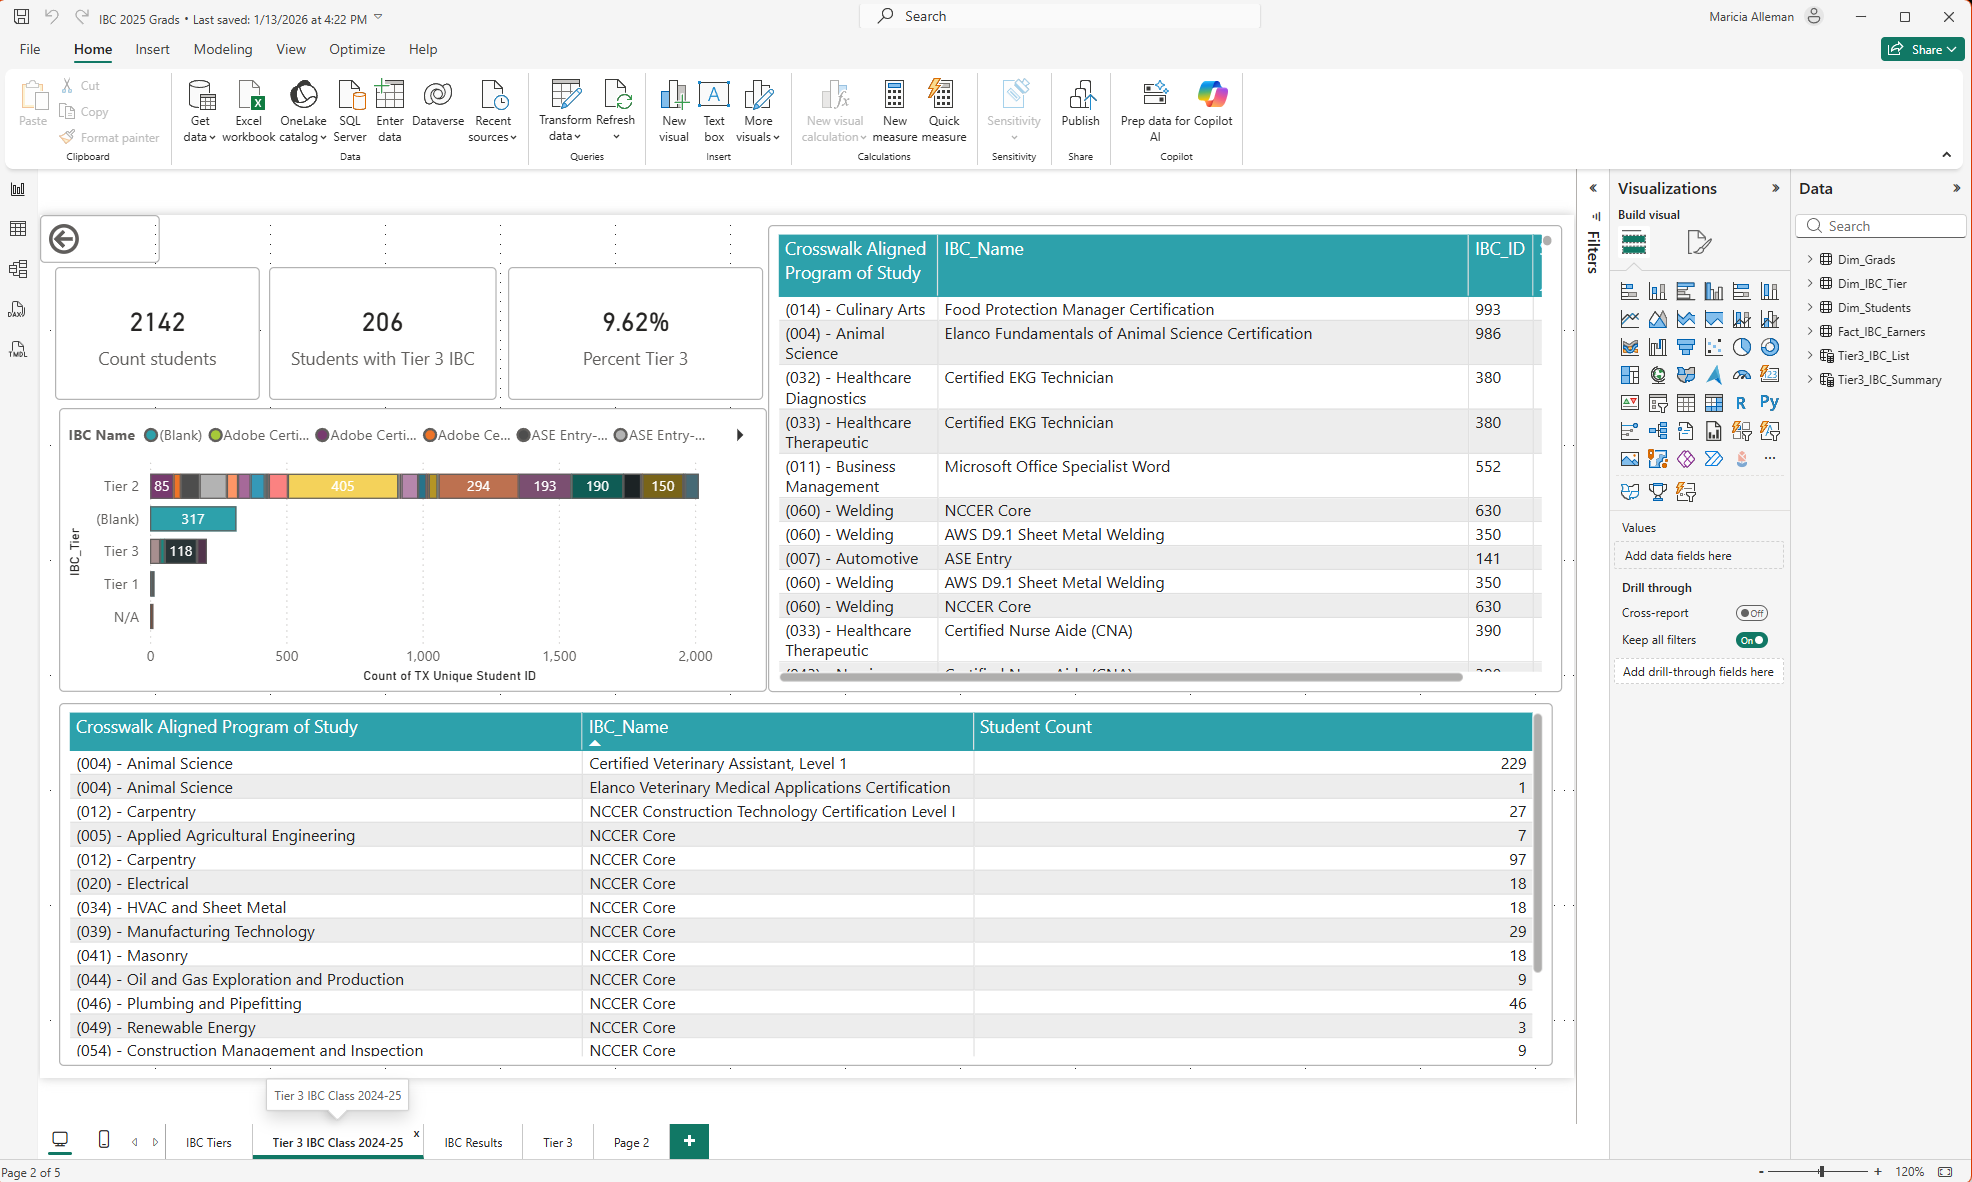
CCMR Classification Engine
TEA-aligned accountability logic for student CCMR buckets.
> Problem
CCMR accountability logic required multiple rules across IBC tiers, TSI, dual credit,
AP/IB, OnRamps, and special populations.
> Solution
Built classification logic to assign students into CCMR buckets, calculate IBC tier
status, and support weighted scoring.
SQL Server
Power BI
DAX
Accountability
> Impact
- Reduced manual CCMR interpretation.
- Aligned reporting to TEA accountability rules.
- Supported campus and district dashboards.
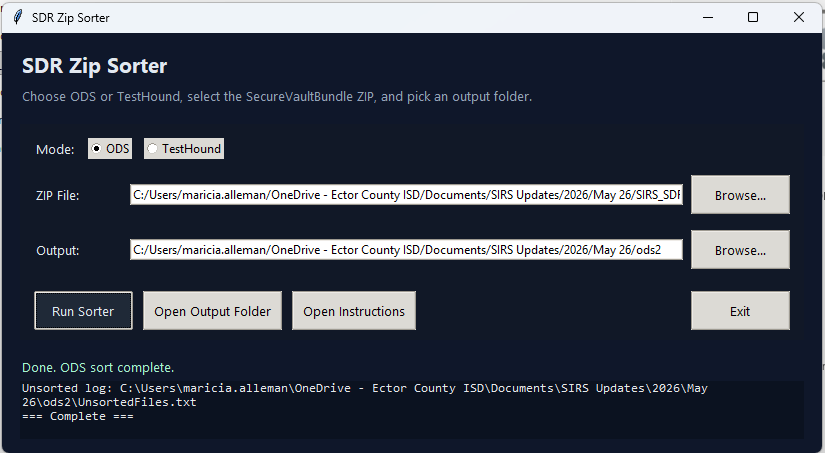
SDR Zip Sorter
Desktop automation tool for organizing state assessment files.
> Problem
SDR assessment files required manual sorting across STAAR, TELPAS, EOC, ODS, and
TestHound workflows.
> Solution
Built a Python/Tkinter desktop tool to select ZIP files, choose a workflow mode, sort
files, and generate unsorted logs.
Python
Tkinter
ZIP Processing
Automation
> Impact
- Reduced manual file handling.
- Standardized output folder structure.
- Created a GUI for non-technical users.
VIEW GITHUB
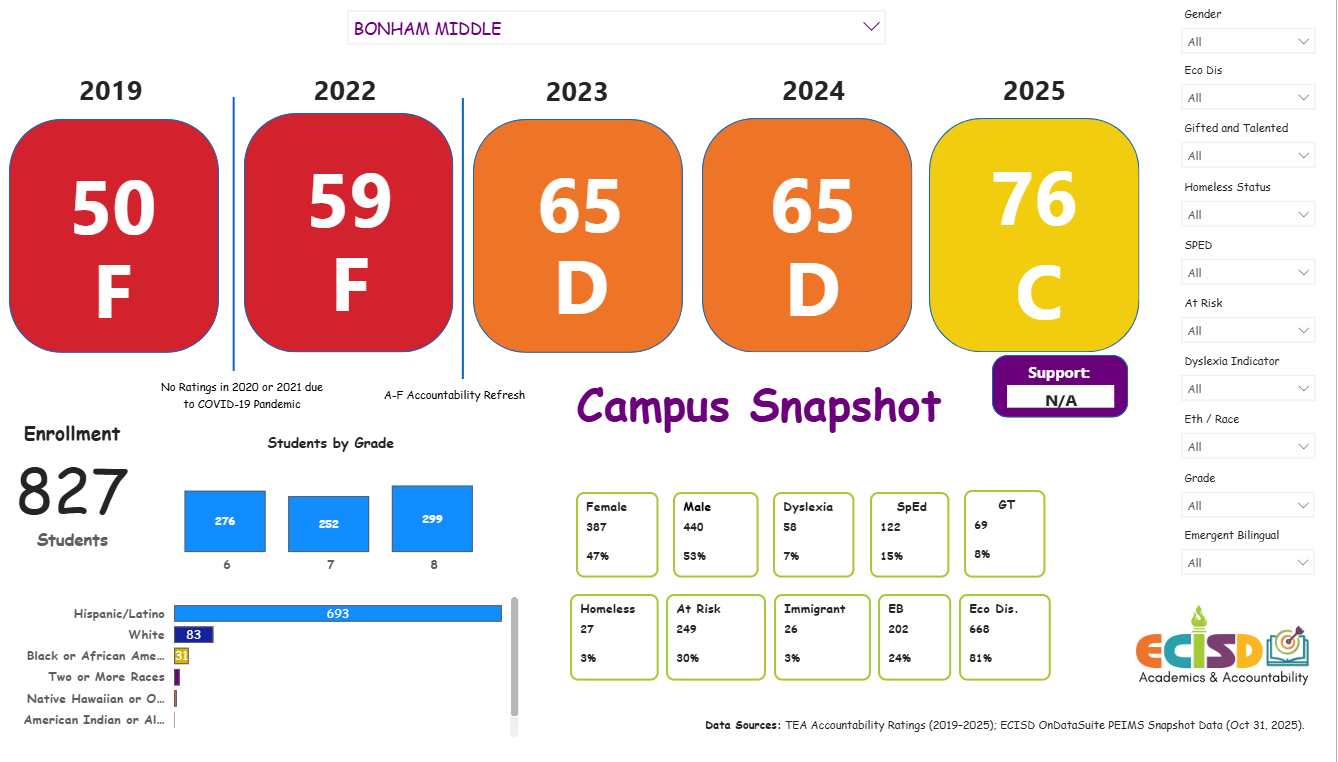
Campus Snapshot Dashboard
Multi-year accountability and demographic reporting.
> Problem
Campus leaders needed one place to view accountability ratings, enrollment,
demographics, and student indicators.
> Solution
Designed a Power BI dashboard combining rating history, enrollment counts, grade
distribution, and student group indicators.
Power BI
DAX
Data Modeling
TEA Data
> Impact
- Created a single-page campus view.
- Improved access to accountability context.
- Supported data-informed campus conversations.
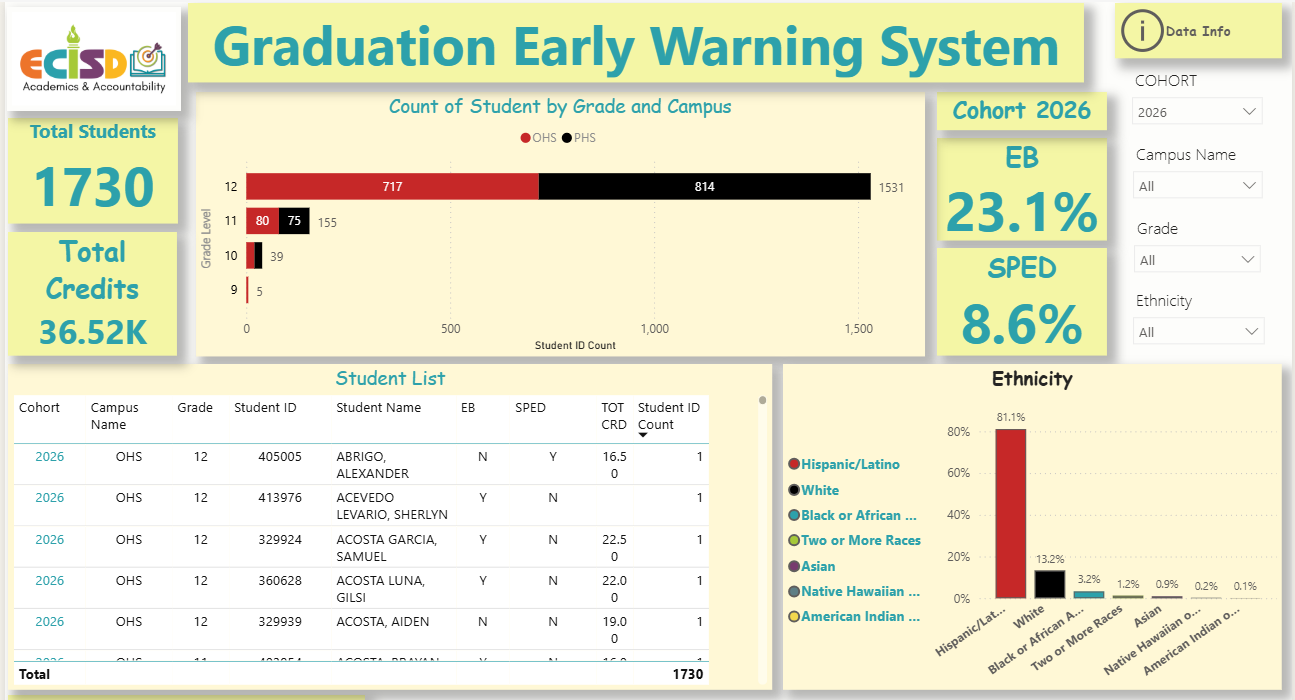
Graduation Early Warning System
Operational dashboard for monitoring cohort progress.
> Problem
Graduation monitoring required student-level visibility into credits, cohort status,
campus distribution, and support indicators.
> Solution
Built an interactive Power BI dashboard with cohort counts, credit tracking, student
groups, and drilldown detail.
Power BI
DAX
Student Analytics
Executive Reporting
> Impact
- Improved visibility into cohort progress.
- Supported intervention planning.
- Turned static reports into actionable monitoring.
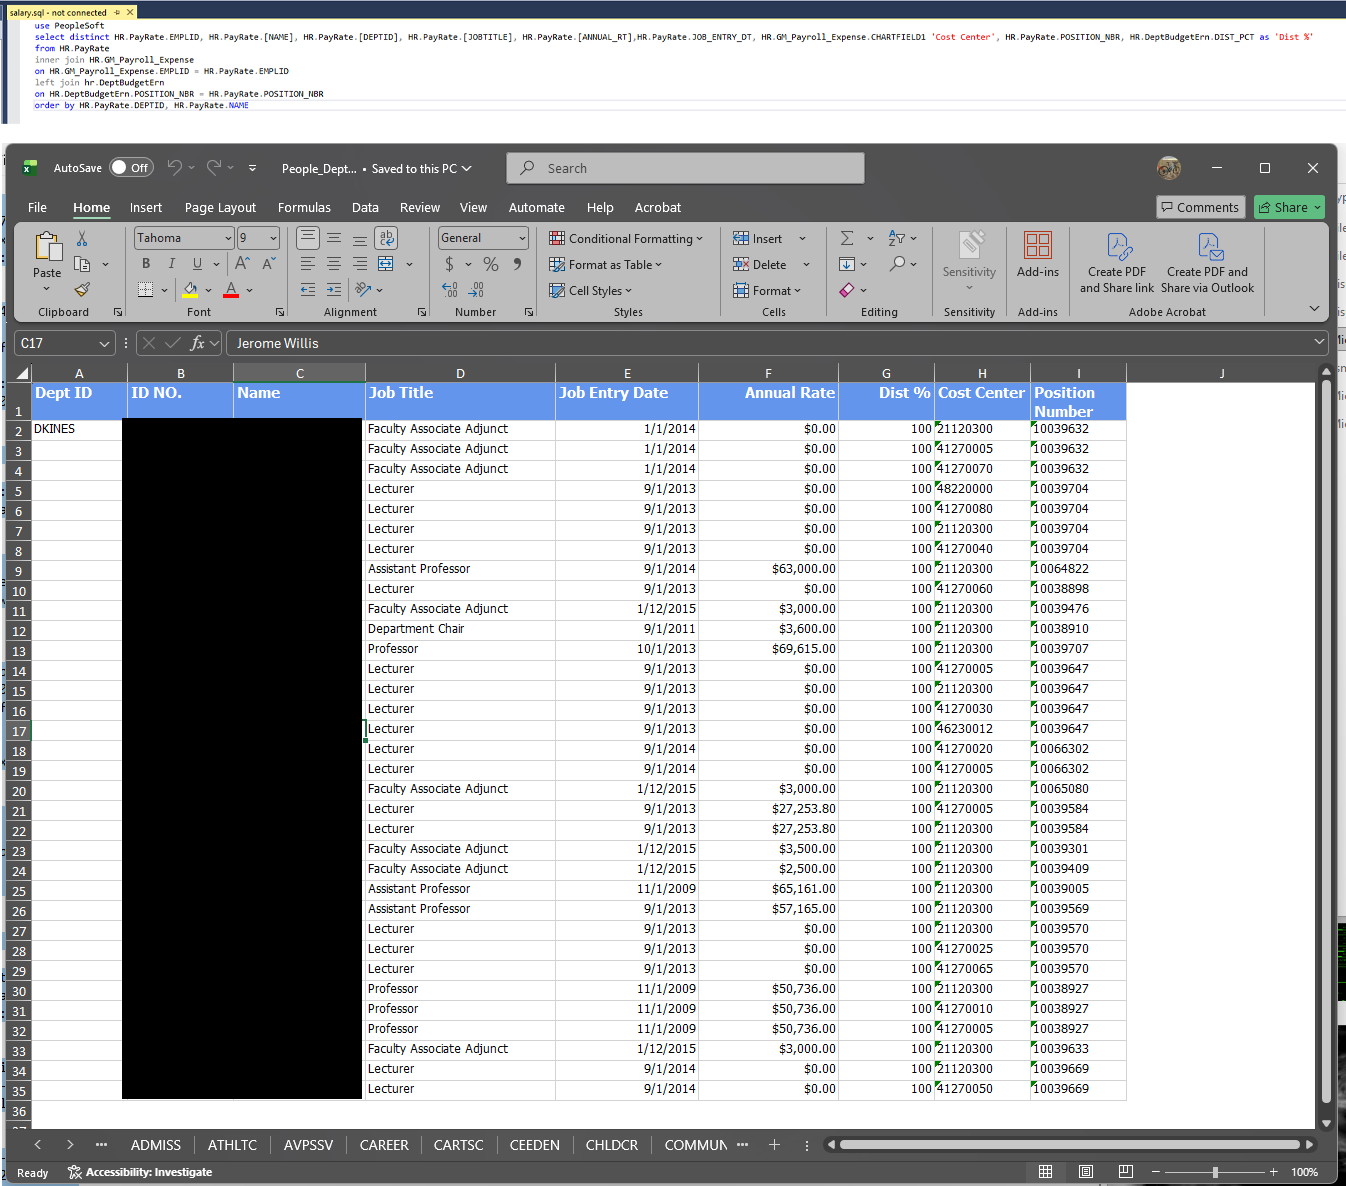
PeopleSoft Data Warehouse
ETL packages importing 79 extracts into SQL Server.
> Problem
Institutional reporting required reliable data from two PeopleSoft databases and
repeated extract processes.
> Solution
Designed and maintained SSIS packages to load structured extracts into a SQL Server data
warehouse for reporting.
SQL Server
SSIS
SSRS
SharePoint BI
> Impact
- Supported institutional compliance reporting.
- Improved reporting data reliability.
- Created reusable warehouse structures.
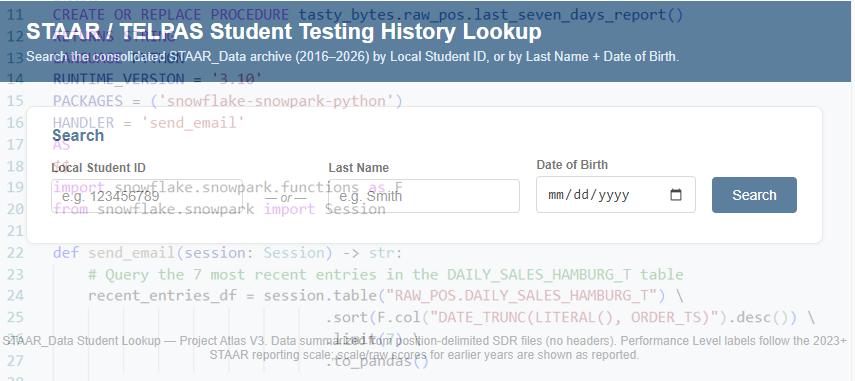
Assessment AI Search
Local search prototype for SDR assessment records and student history.
> Purpose
Built to explore how local assessment data could be searched,
indexed, and queried without depending on a full cloud platform.
Python
SQLite
Data Search
Assessment Data
> Features
- Search by student name, DOB, local ID, or TSDS ID.
- Combines student identity and assessment result tables.
- Returns assessment history and source file details.
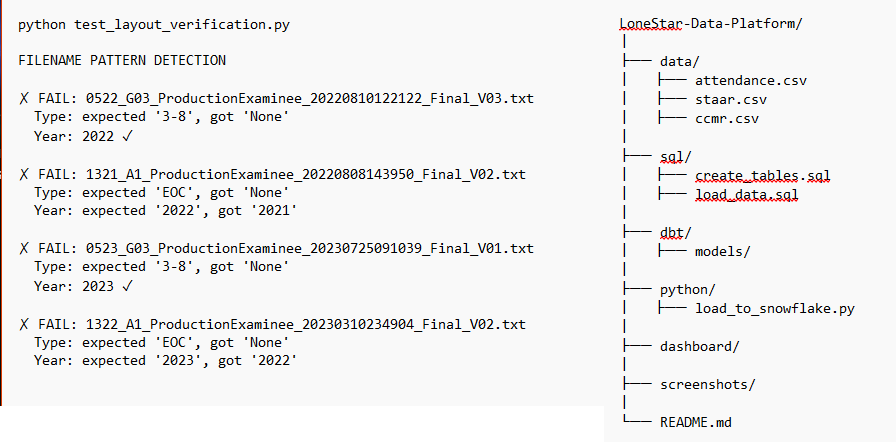
Automation Lab
Small tools, scripts, and experiments for reducing repetitive work.
> Purpose
A collection of small personal experiments using Python,
PowerShell, Power Automate, and file-processing workflows.
Python
PowerShell
Power Automate
File Tools
> Experiments
- Batch file conversion.
- Folder organization utilities.
- Data cleanup helpers.
- Workflow prototypes.

Power BI Phone Directory
Mobile-friendly phone directory integrated with Microsoft Teams.
> Problem
Staff needed a searchable phone directory that worked across desktop and mobile devices
without relying on static PDF exports.
> Solution
Built an automated workflow using Power Automate, Power Apps, Mitel Connect Director,
and
Power BI to create a live phone directory embedded directly inside Microsoft Teams.
Power BI Power Automate Power
Apps
Microsoft Teams Mitel Connect
> Impact
- Automated phone directory updates.
- Provided mobile-friendly staff lookup.
- Embedded directly into Teams.
- Supported multi-format export and printing.
COMPUTER
INVENTORY
LOOKUP
Power BI Computer Inventory Lookup
Searchable computer inventory built from Active Directory, Banner ERP, SQL, Power BI, and
PDQ.
> Problem
Technology inventory data was spread across multiple systems, making it difficult to
quickly look up devices,
users, locations, and related support information.
> Solution
Built a Power BI lookup tool that combined Active Directory, Banner ERP, SQL data, and
PDQ inventory
information into a searchable technology asset view.
Power BI
SQL
Active Directory
Banner ERP
PDQ
> Impact
- Created a searchable computer inventory view.
- Connected user, device, and system data.
- Improved technology support lookup workflows.
- Reduced time spent hunting across separate systems.